shocking!
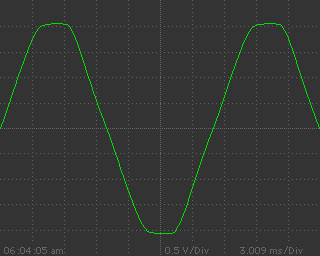
The ac current supplied to your wall sockets is nothing like as 'clean' as you might imagine. Take a look at these:
Here the red trace is a true sine wave, handily generated with M$ Excel; the green trace should be a sine, but was actually recorded one recent Thursday evening (01.08.02, 10.05pm) at the wall socket at home(southern Bath). With everything in the house unplugged (yes, in the dark using a laptop...) Hardly a sine, is it? The peaks are clipped heavily, and there is sufficient harmonic distortion that the zero-crossing is somewhat wibbly (a technical term) too. In fact it amounts to 4.8% THD. By 6am the following morning the waveform had improved somewhat, presumably due to less loading, and the result is shown above right. This kind of variation is normal; we've even seen 14% THD fleetingly at times.
A spectrum analysis of the Thursday evening capture looks like this:
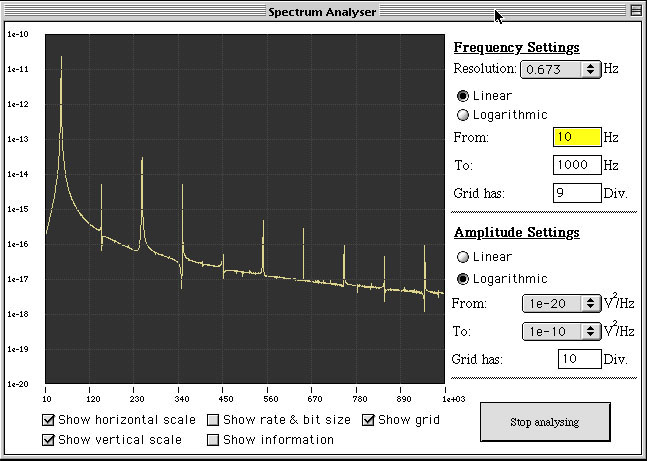
The large peak on the left is the 50Hz mains supply; the rest of the peaks are odd harmonics which contribute to the squared-off waveform. And they shouldn't be there Note in particular the large 3rd, 5th and 7th harmonics (150,250 &350Hz); these are typically contributed by motor drives and direct rectification of the mains - thanks to switched mode power supplies in video recorders, televisions and computers. One thing this image does not convey is the large amount of flicker or low frequency noise. When taking these images, the whole 'skirt' either side of the 50Hz peak oscillated frantically about two orders of magnitude at c. 2-5 Hz (click on the image above to see the movie). In comparison, eight hours later, when everything is nice and quiet and most of the locals still in bed, the spectrum of the mains looks like this:
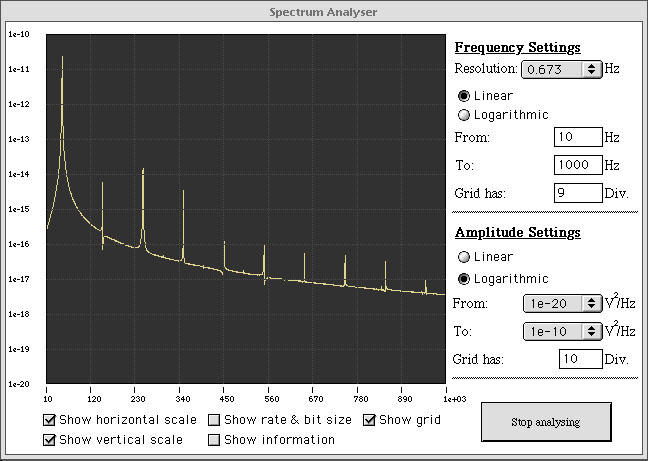
Compare the two spectra: at 6am the 3rd, 5th and 7th harmonics are still significant, but the higher orders are considerably reduced as is the amount of low-level 'hash' between harmonics. In other words, the amount of noise reflects directly the number and variety of electrical loads in the neighbourhood. Opening the window somewhat wider reveals this picture:
There are odd harmonics out beyond 3KHz, right through the most sensitive part of the human hearing range. Note that bands of interference extends much, much higher, and they are not shown on this graph due to the limitations of the kit used in measurement. In short, the situation will be worse than it looks... What does this have to do with audio? We'll be keeping an informal log, and posting here any observations made when things next really sound 'off'.
UPDATE: June 2006
High time to revisit this one. Better measurement technique reveals an even more shocking waveform;
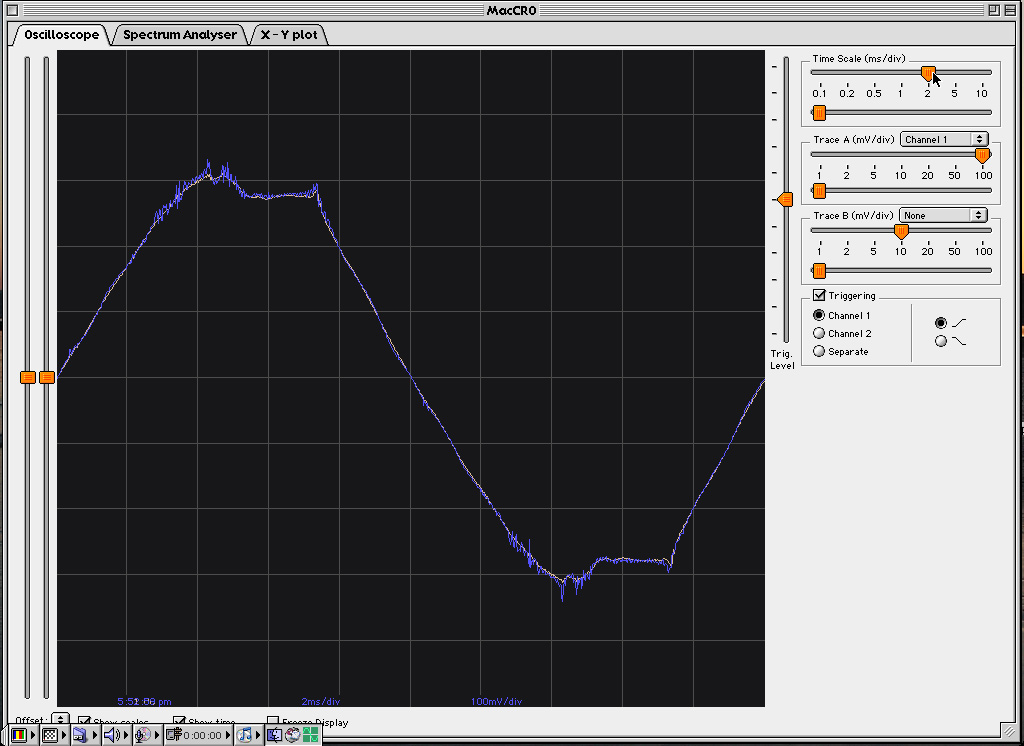
Here are two traces, taken at 6am and 6pm one recent weekday at home in central Bath. 6am is the fawn colour, 6pm in blue. Yes, the evening time mains is worse, but it's only a matter of degree on a pretty horrible basic supply. Check the peak clipping, if you look closely you can see that the rectifiers in everyones TVs, PCs (and hifi) fire for about 3ms as a district average... The resulting spectrum analysis is pretty grim too. ...watch this space..
© the twisted pair 2002